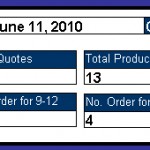
Very often I have been amused by the KPI or Key Performance Indicator’s used in CRM (Customer Relations Management) systems basically displaying the number of leads, sales & revenues. These are usually displayed in a dashboard.
Well MS Access is well know for its switch board which can be viewed as an (inferior) dashboard. This switch board is basically a navigation form used to, well navigate…
The idea of creating a KPI was basically to show the sales & CSR (Customer Service Rep.) what’s going on in the system when multiple users are working, so that information can be effectively tracked.
The Access application I use is 2 tiered, the backend which is also access which holds the database/table part of the application and the front end or GUI is deployed in all the workstations. The database part stays in the server.
Now designing KPI we should also think about the speed in retrieving information from the database because KPI won’t be effective if it takes 1 min to display a field… No One has that kind of TIME!
The KPI’s I choose to display are:
1. Total No. of Invoices billed
Here I want to show the total invoices that are billed for that day. Here since our system sets a status code for the enteries made for that day, I have used a query to filter those entries using the status code and then used DCount feature to get the count:
=DCount("*","qryOrders_Alert")
2. Total No. of Order Quotes entered
Here I need to filter those entries by date. But i did not create an extra query as I was able to reuse the existing query for this deed and filter by Today’s date.
DCount("*","qryFrmQuotes","[saledate] = #" & Date() & "#")
3. Total No. of Products ordered out of the No. of Invoices billed
Here I have used the Dcount to filter by inventory/product ID with the status code used in the invoice
=DCount("dInventoryID","qryOrderDetails_Alert","[ostatus] = 2")
4. Total Invoices Undelivered
Here the undelivered invoices are entered into a different table so I filtered those table using entry date.
=DCount("*","qryrptTrakcBackorders_Alert","[saledate] = #" & Date() & "#")
5. Total Delivery Time Slots fulfilled
We use 3 different time slots and so I used one query by passing time slot parameters to query.
=DCount("*","qryOrderDelTime_Alert","[Odeltime] = '9am-12am'")
=DCount("*","qryOrderDelTime_Alert","[Odeltime] = '12am-5pm'")
=DCount("*","qryOrderDelTime_Alert","[Odeltime] = '9am-5pm'")
Now since data is entered by multiple user, we need to refresh these information every second, so that user gets the most recent count. For this on the form that uses this text boxes, in the On Timer put an event like this:
Me.Refresh
and set the Timer Interval to 3000
You will see that when this code is executed the information on these text boxes flashes like a New York Stock Exchange Ticker!!
I haven’t choose to show any Dollar figure in these KPI because one, the management did not want to, secondly I have seen performance issue in pulling those values.
But an additional set to these would be to show total orders made by various customer categories (if there is one) like by Residential, Restaurants, Hospitals etc
Like any application development anything is possible, just the right approach and right business sense is all it takes.


I really appreciate this post. I have been looking all over for this! Thank goodness I found it on Bing. You’ve made my day! Thx again
Woah this blog is great i love studying your posts. Keep up the good paintings! You recognize, a lot of people are looking round for this info, you could help them greatly.